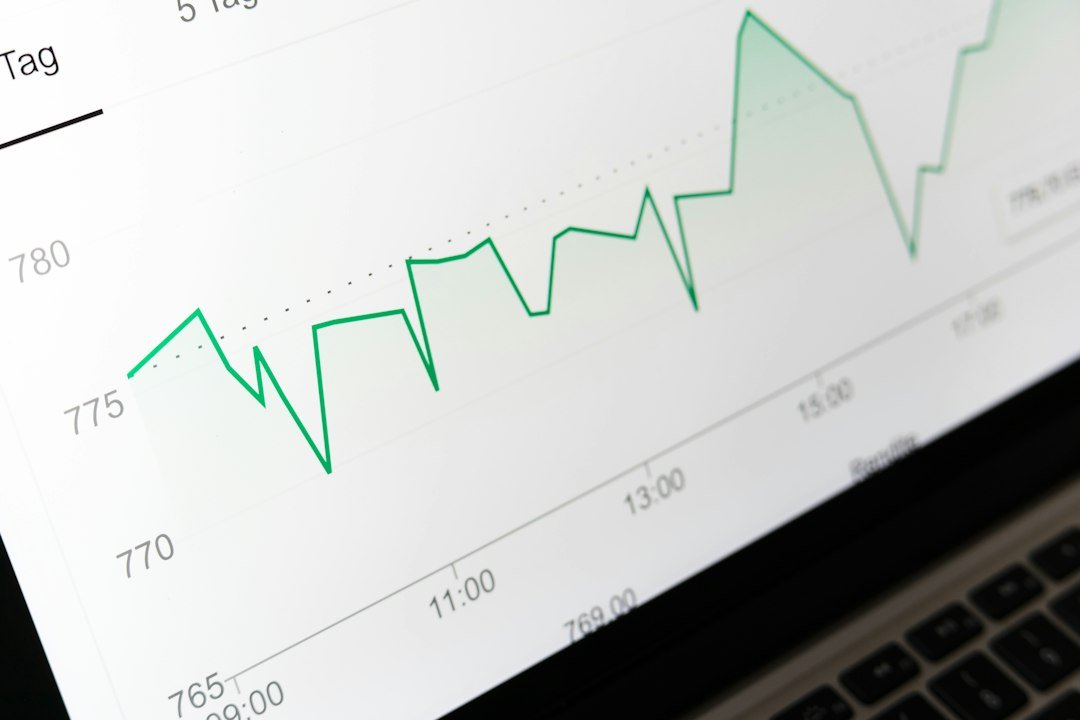
The landscape of retail trading is constantly evolving, driven by technological advancements and the increasing accessibility of sophisticated analytical tools. As we look towards 2026, the discerning US retail trader will find themselves empowered by a suite of powerful platforms designed to cut through market noise, identify opportunities, and refine trading strategies. The ability to leverage data effectively is no longer a luxury but a necessity for sustained success. This article delves into the best trading analytics tools poised to dominate the US retail trading scene in 2026, focusing on their capabilities, unique selling propositions, and how they can empower traders to navigate the complexities of the modern financial markets.
Decoding Market Data: Essential Features for 2026
The core of any effective trading analytics tool lies in its ability to process and present market data in a meaningful and actionable way. For 2026, retail traders will demand more than just raw price charts. They will seek platforms that offer a holistic view of market dynamics, encompassing everything from real-time news sentiment to advanced order flow analysis.
Real-time Data Feeds and Charting Prowess
The foundation of any trading decision is accurate and timely data. In 2026, expect a heightened emphasis on low-latency data feeds for all major US exchanges, including the NYSE, Nasdaq, and Cboe. Tools that offer direct market access (DMA) or highly efficient data aggregation will be paramount. Beyond raw data, the charting capabilities of these platforms will be crucial. This includes not only a wide array of technical indicators (both standard and custom-buildable) but also advanced charting features like:
- Multi-timeframe analysis: The ability to seamlessly switch between different timeframes (e.g., tick, minute, hourly, daily, weekly) to identify trends and patterns at various scales.
- Advanced drawing tools: Sophisticated tools for drawing trendlines, Fibonacci retracements, support/resistance levels, and even custom geometric shapes to mark out potential trading zones.
- Backtesting integration: The ability to test trading strategies directly on historical data using the platform’s charting interface. This allows traders to validate their hypotheses before risking capital.
- Customizable dashboards: The flexibility to create personalized trading screens that display the most relevant information, charts, and indicators for each individual trader’s style and focus.
- Event overlays: The capability to overlay economic calendar events, news releases, and even social media sentiment directly onto price charts, providing context for price movements.
Advanced Order Flow and Volume Analysis
Understanding how orders are executed is increasingly vital for retail traders looking to gain an edge. In 2026, order flow analytics will move beyond simple volume bars to offer deeper insights into market participant behavior. Key features to look for will include:
- Time and Sales (Tape Reading): A real-time stream of executed trades, detailing the price, volume, and time of each transaction. Advanced tools will allow for filtering and highlighting trades based on size, direction, or exchange.
- Footprint Charts: These charts visually represent the volume traded at each price level within a candlestick, revealing the balance between buyers and sellers at specific price points. This can help identify potential supply and demand zones.
- Market Depth (Level 2 Data): Displays the buy and sell orders waiting to be executed at different price levels, offering a glimpse into the immediate supply and demand dynamics. Tools that visualize this data effectively, perhaps through heatmaps or graphical representations, will be highly valued.
- Volume Profile: A histogram that shows the total volume traded at each price level over a specified period. This helps identify significant price areas where considerable trading activity has occurred, often acting as support or resistance.
- VWAP (Volume Weighted Average Price) and its variations: Tools that calculate and display the average price of a security weighted by volume. Traders often use VWAP as a benchmark for intraday trading and execution quality.
AI-Powered Insights and Predictive Analytics
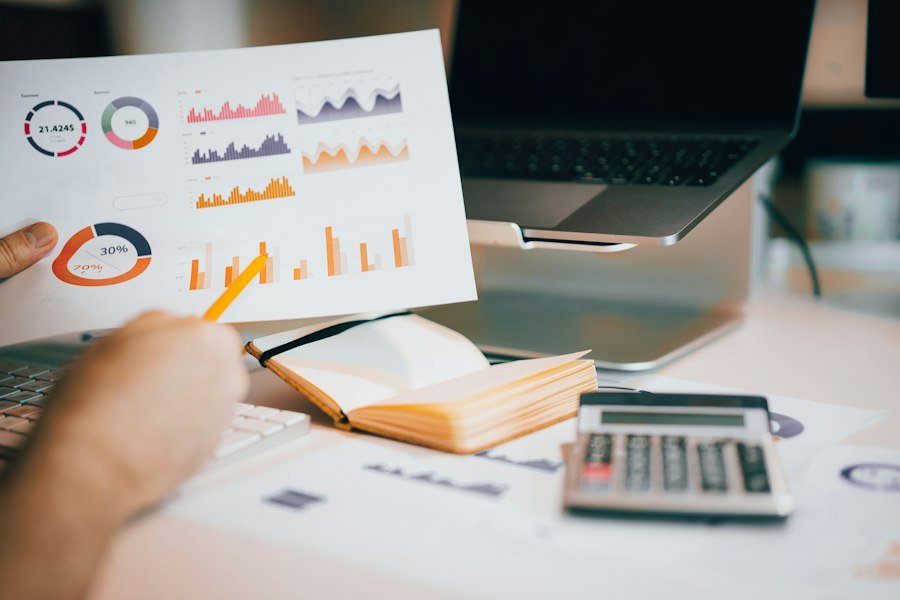
Artificial intelligence (AI) and machine learning (ML) are no longer buzzwords; they are integral components of cutting-edge trading analytics. By 2026, AI-driven tools will provide retail traders with predictive capabilities, anomaly detection, and personalized trading recommendations.
Sentiment Analysis and News Aggregation
The impact of news and market sentiment on price action is undeniable. In 2026, expect AI-powered tools to excel at:
- Real-time News Aggregation: Seamlessly pulling news from thousands of financial sources, including press releases, analyst reports, regulatory filings, and reputable financial news outlets.
- Natural Language Processing (NLP) for Sentiment Analysis: AI algorithms will be capable of understanding the tone and sentiment of news articles, social media posts, and earnings call transcripts. This sentiment can be quantified and presented as a score, helping traders gauge the overall market mood towards a particular asset.
- Event Impact Prediction: AI models can analyze historical data to predict the potential impact of upcoming economic events or news releases on specific asset classes or individual stocks.
- Social Media Monitoring: Sophisticated tools will filter and analyze the vast landscape of social media discussions to identify trending topics, potential market manipulation, or emerging retail sentiment shifts. This can be particularly useful for spotting early interest in certain stocks or sectors.
- Customizable Sentiment Alerts: Traders will be able to set up alerts based on specific sentiment thresholds or keywords related to their watchlist, ensuring they are immediately informed of significant shifts in market opinion.
Algorithmic Trading and Pattern Recognition
AI’s ability to identify complex patterns that are often missed by human observation will be a game-changer for retail traders in 2026. This includes:
- Automated Pattern Recognition: AI algorithms can scan markets for recurring chart patterns (e.g., head and shoulders, flags, pennants) and provide alerts when these patterns are detected.
- Anomaly Detection: AI can identify unusual trading activity or price movements that deviate from normal historical behavior, potentially signaling an impending breakout or a market manipulation attempt.
- Predictive Modeling: AI can leverage historical data, sentiment analysis, and order flow to generate probabilistic forecasts for future price movements. While not foolproof, these predictions can serve as valuable inputs for trading decisions.
- Strategy Optimization: AI can analyze the performance of a trader’s existing strategies and suggest adjustments or identify parameters that could lead to improved results.
- Execution Algorithms: Some advanced platforms will offer AI-powered execution algorithms that can automatically place orders to minimize slippage and achieve optimal entry and exit prices. This is particularly useful for high-frequency traders or those executing large orders.
Comprehensive Portfolio Management and Risk Control
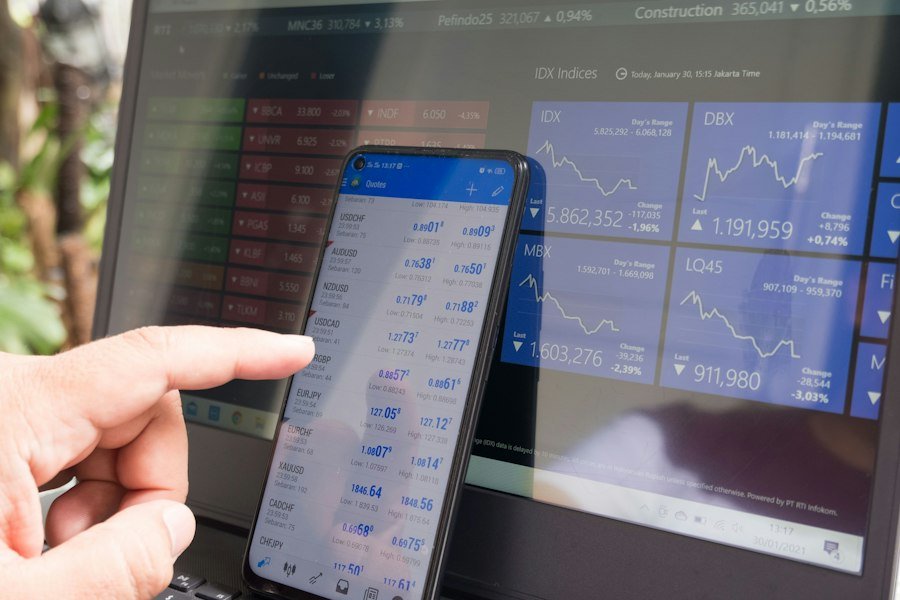
Beyond identifying trading opportunities, effective analytics tools must also assist retail traders in managing their portfolios and controlling risk. In 2026, this will translate to more integrated and intelligent solutions.
Performance Tracking and Analytics
Understanding your trading performance is critical for improvement. Top-tier tools will offer robust performance tracking features, including:
- Detailed Trade History and P&L Analysis: Comprehensive records of all trades, including entry and exit points, profit/loss per trade, and overall portfolio performance.
- Win Rate and Profit Factor Calculation: Key metrics that help traders assess the profitability and efficiency of their strategies.
- Drawdown Analysis: Tools that track and visualize the maximum percentage loss from a peak in portfolio value, crucial for understanding risk tolerance.
- Benchmarking: The ability to compare your trading performance against relevant market indices or peer groups.
- Customizable Reporting: Generating detailed reports tailored to specific trading styles, timeframes, or asset classes.
Real-time Risk Management Tools
Managing risk effectively is paramount to long-term survival in the markets. In 2026, expect analytics tools to offer more proactive and integrated risk management capabilities:
- Portfolio Exposure Monitoring: Real-time tracking of overall portfolio exposure across different asset classes, sectors, and geographic regions.
- Position Sizing Calculators: Tools that help traders determine appropriate position sizes based on their risk tolerance, account size, and the volatility of the asset being traded.
- Stop-Loss and Take-Profit Automation: Seamless integration with brokerage accounts to automatically place and manage stop-loss and take-profit orders, crucial for disciplined trading.
- Correlation Analysis: Tools that analyze the correlation between different assets in a portfolio, helping traders identify areas of concentrated risk.
- Scenario Analysis and Stress Testing: The ability to simulate the impact of adverse market conditions (e.g., a sudden interest rate hike, a major geopolitical event) on a portfolio.
- Capital at Risk (VaR) Calculation: Advanced tools may offer Value at Risk calculations to quantify potential losses over a given time horizon.
Integration and Accessibility: The Modern Trader’s Toolkit
The best trading analytics tools in 2026 will not exist in isolation. They will be characterized by seamless integration with brokerage platforms, user-friendly interfaces, and cross-device accessibility.
Brokerage Integration and API Connectivity
The days of manual data entry or cumbersome workarounds are fading. In 2026, expect deep integration between analytics platforms and leading US brokerages. This will manifest as:
- Direct Trading Execution: The ability to place trades directly from the analytics platform into your brokerage account.
- Real-time Account Sync: Instantaneous updates of account balances, positions, and P&L within the analytics platform.
- API Access: For more advanced traders and developers, robust APIs will allow for custom integrations with proprietary trading systems, data feeds, and automated strategies.
- Customizable Watchlists and Order Management: Synchronization of watchlists and order statuses between the analytics platform and the brokerage.
User Interface (UI) and User Experience (UX)
Even the most powerful analytics tool is useless if it’s difficult to use. In 2026, there will be a strong emphasis on intuitive design and a smooth user experience. This includes:
- Clean and Customizable Dashboards: Easy-to-navigate interfaces that allow traders to tailor their workspace to their specific needs.
- Intuitive Navigation: Logical menu structures and clear labeling that make it easy to find the tools and information required.
- Visualizations and Graphics: Effective use of charts, graphs, and heatmaps to present complex data in an easily digestible format.
- Onboarding and Education: Comprehensive tutorials, help documentation, and customer support to assist new users in getting the most out of the platform.
- Cross-Device Compatibility: Seamless access and functionality across desktop computers, laptops, tablets, and smartphones, allowing traders to stay connected and make decisions on the go.
Emerging Trends and Future-Proofing Your Trading
| Tool Name | Key Features | Data Coverage | Pricing Model | User Rating (out of 5) | Best For |
|---|---|---|---|---|---|
| TradeStation | Advanced charting, real-time data, customizable strategies | Stocks, Options, Futures, Forex | Subscription + Commission | 4.5 | Active traders and algorithmic trading |
| Thinkorswim (by TD Ameritrade) | Robust analytics, paper trading, technical indicators | Stocks, Options, ETFs, Futures | Free with brokerage account | 4.7 | Retail traders seeking comprehensive tools |
| TradingView | Social trading, cloud charts, scripting language (Pine Script) | Stocks, Forex, Crypto, Indices | Freemium with premium tiers | 4.6 | Charting and community-driven insights |
| MetaStock | Technical analysis, forecasting tools, expert advisors | Stocks, Futures, Forex | One-time license + data fees | 4.2 | Technical analysts and system traders |
| TrendSpider | Automated technical analysis, backtesting, alerts | Stocks, ETFs, Crypto | Subscription-based | 4.4 | Trend and pattern recognition |
| QuantConnect | Algorithmic trading platform, cloud backtesting, multi-asset | Stocks, Forex, Crypto, Futures | Freemium with paid plans | 4.3 | Quantitative and algo traders |
The financial markets are a dynamic environment, and the tools that power trading must evolve to keep pace. As we look to 2026 and beyond, several emerging trends will shape the future of trading analytics.
Decentralized Finance (DeFi) and Alternative Data
While traditional markets will remain dominant, the influence of decentralized finance (DeFi) and the utilization of alternative data sources will continue to grow. Analytics tools in 2026 might start incorporating:
- DeFi Data Integration: For traders interested in the nascent DeFi space, tools may begin to offer data feeds and analytics for cryptocurrencies, decentralized exchanges (DEXs), and various DeFi protocols.
- Alternative Data Sources: This could include satellite imagery (e.g., for tracking retail foot traffic or oil tanker movements), credit card transaction data, web scraping data (e.g., for analyzing product demand), and even geolocation data. AI will be crucial in processing and extracting value from these unconventional datasets.
- Blockchain Analytics: For assets traded on blockchains, tools may offer on-chain analytics to track transaction volumes, wallet activity, and smart contract interactions.
Community and Social Trading Features
The rise of social trading platforms has demonstrated the power of community in financial markets. In 2026, expect more analytics tools to incorporate collaborative and social elements:
- Integrated Trading Communities: Platforms that foster discussion forums, chat rooms, and idea-sharing among traders.
- Social Sentiment Indicators: Tools that aggregate and analyze sentiment from social media and trading forums to gauge collective market opinion.
- Follower/Following Features: The ability for traders to follow the strategies and performance of other successful traders, with varying degrees of transparency and permission.
- Collaborative Research Tools: Features that allow teams of traders to share research, analysis, and trading ideas.
Ultimately, the “best” trading analytics tool for a US retail trader in 2026 will depend on their individual trading style, experience level, and strategic objectives. However, by prioritizing platforms that offer robust data analysis, AI-powered insights, comprehensive risk management, seamless integration, and a user-friendly experience, traders can equip themselves with the tools necessary to navigate the complexities of the financial markets and strive for success in the years to come. The future of trading analytics is here, and it’s more powerful and accessible than ever before.