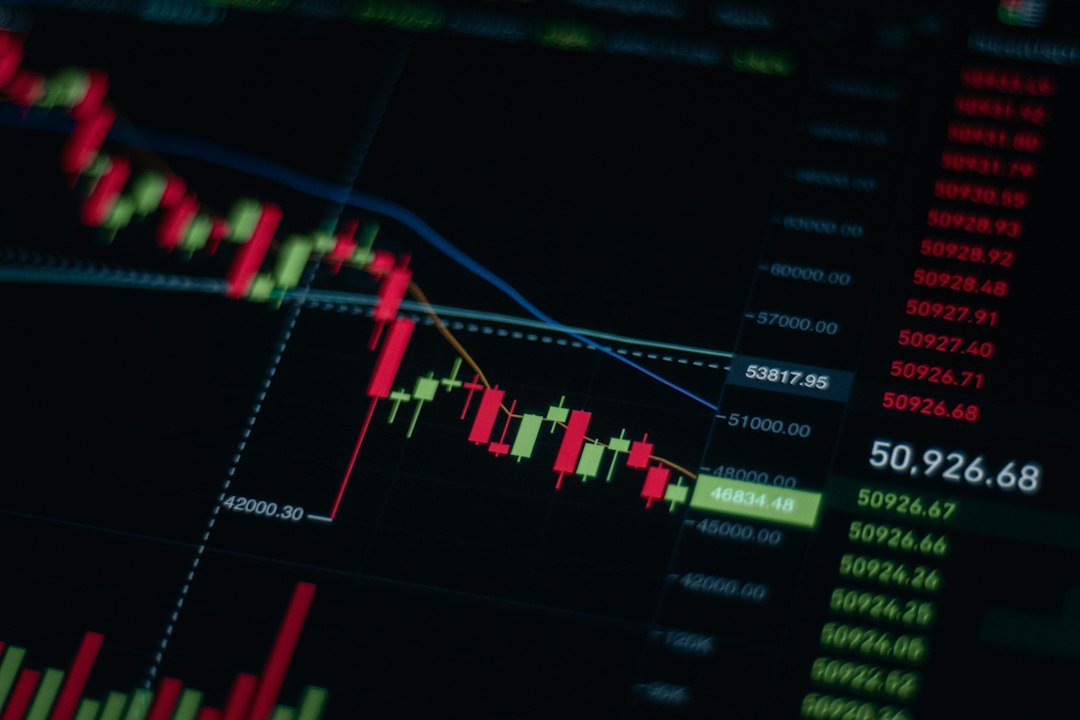
The Inevitable Trough: Defining Drawdown
In the dynamic world of investing, the journey of capital is rarely a straight line upwards. Fluctuations are inherent, and even the most seasoned investors will experience periods where the value of their portfolio declines from a previous peak. This decline, from a high point to a subsequent low point before a new peak is achieved, is what we commonly refer to as a “drawdown.” It’s a critical concept, often overlooked by novice investors captivated by the allure of gains, but intimately understood by professionals who navigate the market’s ebb and flow.
Understanding drawdown goes beyond merely acknowledging a temporary loss. It’s a fundamental metric for risk assessment and performance evaluation. While a portfolio might show an impressive annualized return, a deep and prolonged drawdown along the way can erode confidence, trigger emotional decisions, and ultimately impact long-term wealth accumulation. Imagine an investment that returns 20% annually but experiences a 50% drawdown at some point. An investor who bought at the peak and exited at the trough would have lost half their capital, despite the fund’s overall positive performance. This highlights why focusing solely on returns without considering the journey is a perilous approach.
Drawdown is not necessarily a sign of a bad investment; rather, it’s an intrinsic part of market cycles and the risk-reward paradigm. Even the most robust strategies and diversified portfolios will encounter drawdowns. What differentiates successful investors and strategies is their ability to understand, measure, and effectively manage these periods of decline. It’s about being prepared for the inevitable, rather than being surprised by it.
The Anatomy of a Drawdown
A drawdown begins once the value of an investment or portfolio falls below a previously achieved high watermark. It continues until a new peak is established, at which point the drawdown is considered “recovered.” The magnitude of a drawdown is typically expressed as a percentage, reflecting the peak-to-trough decline. For example, if a portfolio reached a peak of $100,000 and subsequently fell to $70,000 before recovering, the drawdown would be 30%.
It’s crucial to distinguish between an unrealized loss and a drawdown. An unrealized loss simply means the current market value is below your purchase price. A drawdown, however, specifically refers to the decline from an existing peak. This distinction is important because a portfolio can be in an unrealized loss without being in a drawdown from its absolute peak if previous gains have already been made and then partially lost. Conversely, a portfolio could be in a drawdown even if it’s still significantly above its initial purchase price.
Why Drawdown Matters
Beyond the immediate financial impact, drawdowns carry significant psychological weight. Behavioral finance studies consistently show that investors feel the pain of losses more acutely than the pleasure of equivalent gains. A deep drawdown can trigger panic selling, leading investors to lock in losses and miss out on subsequent recoveries. This behavioral pitfall is a primary reason why many individual investors underperform the market. By understanding and mentally preparing for drawdowns, investors can develop the resilience needed to stick to their investment plan.
Furthermore, drawdowns impact the compounding effect. Recovering from a significant drawdown requires even larger percentage gains. For example, a 10% drawdown requires an 11.11% gain to recover. A 20% drawdown requires a 25% gain. A 50% drawdown, however, requires a staggering 100% gain just to get back to even. This non-linear relationship underscores the importance of minimizing the depth and duration of drawdowns, as they can significantly hinder long-term wealth accumulation.
Quantitative Measures: How to Measure Drawdown Effectively
Measuring drawdown is not a one-size-fits-all exercise. Different metrics provide varying insights into the depth, duration, and frequency of these declines. A comprehensive understanding requires looking beyond a single number and analyzing several key indicators. Professional investors and analysts employ a suite of tools to dissect drawdowns, enabling a more nuanced assessment of risk and performance.
Maximum Drawdown (MDD)
The most commonly cited drawdown metric, Maximum Drawdown (MDD), represents the largest percentage drop from a peak to a trough in a given period. It’s a historical measure that tells you the worst-case scenario an investor would have experienced if they bought at the absolute peak and sold at the absolute bottom during that timeframe.
Calculating MDD involves:
- Identifying all new equity peaks in the performance history.
- For each peak, finding the lowest point reached before a new peak is established.
- Calculating the percentage drop for each of these peak-to-trough movements.
- The largest of these percentage drops is the Maximum Drawdown.
For example, if a portfolio started at $100, grew to $150, then dropped to $120, then recovered to $160, then dropped to $80, and finally recovered to $170:
- Peak 1: $150. Trough after Peak 1: $120. Drawdown 1: ($150-$120)/$150 = 20%.
- Peak 2: $160 (new highest peak). Trough after Peak 2: $80. Drawdown 2: ($160-$80)/$160 = 50%.
- The MDD for this period would be 50%.
MDD is a crucial metric for understanding tail risk – the risk of extreme negative events. It provides a stark reminder of the potential downside. However, MDD is a single, backward-looking number. It doesn’t tell you how frequently drawdowns occurred, their typical duration, or if the market conditions that led to that MDD are still prevalent.
Drawdown Duration and Recovery Period
Beyond the depth, the time aspect of a drawdown is equally important.
- Drawdown Duration: This measures the length of time from a peak until the subsequent trough. A short, sharp drawdown might be less concerning than a prolonged, shallower one, depending on an investor’s time horizon and liquidity needs.
- Recovery Period: This measures the length of time from the trough of a drawdown until the portfolio reaches a new peak, thereby fully recovering the losses incurred during that drawdown. A rapid recovery is generally preferred, as it minimizes the opportunity cost of capital tied up in a losing position.
Consider two portfolios, both with a 20% maximum drawdown. Portfolio A experiences this drawdown over 3 months and recovers in another 3 months. Portfolio B experiences the same 20% drawdown over 12 months and takes 24 months to recover. While their MDD is the same, Portfolio A is clearly more appealing due to its quicker return to profitability, which allows capital to be redeployed more efficiently.
Frequency and Distribution of Drawdowns
Analyzing the frequency and distribution of drawdowns provides a more holistic picture of an investment’s risk profile.
- Number of Drawdowns: How many times has the portfolio experienced a decline from a peak within a given period? A strategy with frequent small drawdowns might be preferred over one with infrequent but extremely deep ones, depending on risk tolerance.
- Average Drawdown: The average percentage decline of all observed drawdowns. This helps in understanding the typical magnitude of declines.
- Average Drawdown Duration/Recovery: The average time spent in a drawdown or recovering from one.
Sophisticated analysis might involve creating a drawdown curve, which plots the portfolio value relative to its historical peaks over time. This visual representation can quickly highlight periods of stress and recovery. Furthermore, examining the distribution of drawdowns can reveal if a strategy is prone to many small losses or a few large ones, offering insights into its risk characteristics.
Calmar Ratio and Sterling Ratio
These are risk-adjusted return metrics that specifically incorporate drawdown into their calculation.
- Calmar Ratio: (Compounded Annual Growth Rate / Maximum Drawdown). A higher Calmar Ratio indicates a better return for a given level of maximum drawdown. It essentially tells you how much annual return you’ve generated per unit of worst-case capital loss.
- Sterling Ratio: (Compounded Annual Growth Rate / Average Maximum Drawdown). The “average maximum drawdown” here is typically defined as the average of the largest x drawdowns or a specific method to smooth out the single extreme MDD. It aims to provide a more stable measure of downside risk compared to MDD.
These ratios are invaluable for comparing different investment strategies. A strategy with a higher absolute return might not be superior if it comes with a disproportionately larger maximum drawdown, as indicated by a lower Calmar or Sterling ratio.
Other Contextual Considerations
When measuring drawdown, it’s vital to consider the context:
- Time Horizon: A short-term trader might be more concerned with daily drawdowns, while a long-term investor is more interested in annual or multi-year drawdowns.
- Market Conditions: Was the drawdown during a broader market correction or a specific sector downturn? Understanding the drivers can help in assessing whether the drawdown is an inherent flaw in the strategy or a consequence of external market forces.
- Asset Class: Different asset classes have different expected drawdown profiles. Equities generally have higher drawdowns than bonds, for example. Comparing a stock portfolio’s drawdown to a bond portfolio’s drawdown without considering this difference would be misleading.
Strategic Imperatives: Managing Drawdown Proactively

Measuring drawdown is only the first step; the real challenge lies in effectively managing it. Proactive drawdown management is not about eliminating drawdowns entirely – that’s an unrealistic goal in most investment contexts – but rather about minimizing their depth and duration, and ensuring they remain within an acceptable risk tolerance. This requires a robust investment framework built on diversification, risk-conscious asset allocation, and adaptive strategies.
Diversification: The Cornerstone of Risk Mitigation
The oldest trick in the book, diversification, remains one of the most effective tools for managing drawdown. By spreading investments across different asset classes, geographies, sectors, and investment styles, you reduce the impact of a single underperforming asset or market segment. When one part of your portfolio is declining, another might be holding steady or even rising, thus cushioning the overall portfolio’s fall.
For instance, a portfolio solely invested in growth stocks might experience a deep drawdown during a market shift towards value or rising interest rates. However, a diversified portfolio that includes bonds, real estate, commodities, and international equities would likely see a shallower overall drawdown because these assets often have different correlations and react differently to the same market events.
Asset Allocation and Rebalancing
Strategic asset allocation involves determining the optimal mix of asset classes based on an investor’s risk tolerance, time horizon, and financial goals. A conservative allocation with a higher proportion of fixed income will generally experience shallower drawdowns than an aggressive, all-equity portfolio. The key is to find the allocation that allows an investor to weather market downturns without panicking and abandoning their strategy.
Regular rebalancing is an essential companion to asset allocation. Over time, market movements can shift your portfolio away from its target allocation. If equities have performed well, their weight in the portfolio will increase, making the portfolio riskier. Rebalancing involves selling appreciated assets and buying underperforming ones to restore the original target allocation. This systematic approach forces investors to “buy low and sell high” and prevents the portfolio from becoming overly concentrated in assets that have become expensive, which can exacerbate drawdowns.
Stop-Loss Orders and Trailing Stops
For individual securities or tactical trading strategies, stop-loss orders can be a direct mechanism to limit potential drawdowns. A stop-loss order automatically sells a security if its price falls to a predetermined level, thus capping the maximum loss on that particular position.
- Fixed Stop-Loss: Sets a specific price point at which the asset will be sold. For example, if you buy a stock at $100, you might set a stop-loss at $90, limiting your loss to 10%.
- Trailing Stop-Loss: More dynamic, it moves up as the asset’s price increases, locking in profits while still protecting against a significant reversal. If a stock you own at $100 rises to $120, a 10% trailing stop would move from $90 to $108. If the stock then drops to $107.99, it would be sold.
While effective in limiting losses on individual positions, stop-loss orders must be used judiciously. They can sometimes trigger premature sales during temporary market volatility, leading to “whipsawing” where you sell at the bottom only to see the price rebound. They are generally more suited for short-term trading or specific high-conviction positions rather than broad portfolio management.
Dynamic Risk Management and Hedging
More sophisticated strategies involve dynamic risk management and hedging techniques.
- Volatility Targeting: Some strategies adjust their exposure to risky assets based on current market volatility. During periods of high volatility (which often precede or accompany drawdowns), the strategy might reduce its equity exposure, and vice versa.
- Options and Derivatives: Options contracts (puts) can be used to hedge against downside risk in a portfolio. Buying put options on an index or individual stocks can provide insurance against a market downturn, offsetting losses in the underlying portfolio. This comes at a cost (the option premium) and requires expertise to implement effectively.
- Cash Management: Holding a strategic cash reserve can be a form of drawdown management. During market downturns, cash provides dry powder to buy distressed assets at lower prices, which can accelerate recovery from a drawdown.
These advanced techniques are often employed by institutional investors and require a deep understanding of financial markets. For individual investors, diversification and sensible asset allocation remain the most accessible and powerful tools.
Behavioral Resilience: Navigating Drawdown Psychologically
Even the best-laid plans and most robust quantitative measures can be undone by poor behavioral responses during a drawdown. The emotional toll of watching your portfolio decline can be immense, often leading to irrational decisions. A crucial aspect of managing drawdown, therefore, is cultivating behavioral resilience and adhering to a disciplined investment philosophy.
The Pain of Loss: A Psychological Burden
Behavioral economics consistently highlights the “loss aversion” bias – the psychological phenomenon where the pain of losing money is roughly twice as powerful as the pleasure of gaining an equivalent amount. During a drawdown, this bias is in full force. Every percentage point decline feels worse than the joy of the previous percentage point gain. This often manifests as:
- Panic Selling: The fear of further losses drives investors to sell positions at the bottom, locking in losses and missing the subsequent recovery. This is arguably the most detrimental behavioral mistake during a drawdown.
- Confirmation Bias: Investors might seek out news and opinions that confirm their negative outlook, reinforcing their fear and inclination to sell.
- Recency Bias: Overemphasizing recent market performance, leading to the belief that the current downturn will continue indefinitely.
Recognizing these inherent psychological biases is the first step toward mitigating their impact.
Cultivating a Long-Term Perspective
One of the most powerful antidotes to drawdown-induced panic is a firm long-term perspective. History repeatedly shows that equity markets, despite numerous corrections and bear markets, have always recovered and reached new highs over sufficiently long periods.
- Focus on Goals, Not Daily Fluctuations: Remind yourself of your original financial goals – retirement, a down payment, children’s education. These goals are often decades away, rendering short-term market fluctuations less significant.
- Time in the Market, Not Timing the Market: Trying to time market bottoms and tops is notoriously difficult, even for professionals. A disciplined approach of staying invested and consistently contributing (dollar-cost averaging) through market cycles tends to outperform attempts to jump in and out.
- Historical Context: Reviewing historical market drawdowns and recoveries can provide comfort and perspective. Understanding that current downturns are not unprecedented can help normalize the experience and reduce anxiety.
Having a Pre-Defined Investment Plan
A well-articulated investment plan acts as a behavioral anchor during turbulent times. This plan should outline:
- Risk Tolerance: A realistic assessment of how much volatility and potential loss you can stomach without losing sleep.
- Asset Allocation: Your target mix of assets based on your risk tolerance and goals.
- Rebalancing Rules: Clear guidelines on when and how to adjust your portfolio back to its target allocation.
- Cash Reserves: Maintaining an emergency fund and sufficient liquidity outside your investment portfolio ensures you won’t be forced to sell investments during a downturn to meet immediate financial needs.
By having a plan in place before a drawdown occurs, you reduce the need for emotional, on-the-spot decisions. The plan dictates your actions, not your feelings.
Seeking Professional Guidance
For many investors, engaging with a qualified financial advisor can be invaluable for navigating drawdowns. An advisor can:
- Provide an Objective Voice: Act as a behavioral coach, preventing impulsive decisions during market stress.
- Help Define Risk Tolerance: Assist in accurately assessing your true capacity and willingness to take on risk.
- Construct a Robust Plan: Help build a diversified portfolio and a rebalancing strategy tailored to your needs.
- Offer Education and Context: Explain market cycles and the historical context of drawdowns, reinforcing a long-term perspective.
Ultimately, managing drawdown psychologically is about discipline, perspective, and an unwavering commitment to your long-term financial goals, even when the market tests your resolve.
Future-Proofing: Learning from Past Drawdowns
| Metric | Description | Formula / Calculation | Purpose |
|---|---|---|---|
| Drawdown | The peak-to-trough decline during a specific period of an investment | (Peak Value – Trough Value) / Peak Value | Measures the loss from the highest point to the lowest point |
| Maximum Drawdown (Max DD) | The largest drawdown observed over a specified time frame | Max of all drawdowns during the period | Assesses worst-case loss scenario |
| Drawdown Duration | Length of time from peak to recovery back to previous peak | Number of periods between peak and recovery | Measures how long it takes to recover losses |
| Recovery Time | Time taken to return to the previous peak value after a drawdown | Time from trough to new peak | Evaluates resilience of investment |
| Calmar Ratio | Risk-adjusted return metric using maximum drawdown | Annualized Return / Maximum Drawdown | Measures return per unit of drawdown risk |
| Ulcer Index | Measures depth and duration of drawdowns | Square root of average squared drawdowns over period | Quantifies investment stress due to drawdowns |
The past is a rich source of lessons for navigating future market downturns. While history doesn’t repeat itself precisely, patterns of market behavior and investor psychology often rhyme. Analyzing past drawdowns, both in your own portfolio and in broader market indices, provides invaluable insights for improving future investment strategies and enhancing resilience.
Post-Mortem Analysis of Personal Drawdowns
Every investor should conduct a “post-mortem” analysis of any significant drawdowns experienced in their own portfolio. This isn’t about dwelling on mistakes but about learning from them.
- Identify Triggers: What caused the drawdown? Was it a broad market correction, a sector-specific downturn, an individual stock’s poor performance, or perhaps an overconcentration in a particular asset?
- Assess Magnitude and Duration: How deep was the drawdown, and how long did it take to recover? Compare this to your risk tolerance and expectations.
- Evaluate Strategy Response: How did your investment strategy perform during the downturn? Did your diversification hold up? Were your stop-losses effective? Did you stick to your rebalancing plan?
- Identify Behavioral Errors: Did you panic sell? Did you become too optimistic at the peak or too pessimistic at the trough? Be honest about your emotional responses.
- Actionable Insights: Based on this analysis, what changes can you make to your portfolio construction, risk management rules, or behavioral approach to better prepare for the next drawdown? This might involve adjusting asset allocation, diversifying further, refining stop-loss strategies, or simply reinforcing your commitment to a long-term plan.
Understanding Major Historical Market Drawdowns
Studying major historical market drawdowns provides a broader context and highlights common themes. From the Great Depression to the Dot-Com Bubble, the 2008 Financial Crisis, and the COVID-19 pandemic, each downturn offers unique lessons.
- The Depth and Breadth of Downturns: Observe how different asset classes and sectors performed during these periods. Which assets acted as safe havens? Which were most vulnerable?
- Duration of Bear Markets and Recoveries: Understanding that recoveries can take time is crucial. The market doesn’t always snap back quickly.
- Impact of Policy Responses: Analyze how monetary and fiscal policies influenced the duration and severity of drawdowns and subsequent recoveries.
- Behavioral Lessons from the Masses: Witnessing the collective panic and subsequent capitulation during historical drawdowns underscores the importance of an independent, disciplined approach.
For example, observing the deep and prolonged drawdown during the Great Depression reinforced the importance of capital preservation. The rapid, sharp drawdown of COVID-19 highlighted the speed at which modern markets can react, while the subsequent swift recovery underscored the power of central bank intervention and technological resilience.
Stress Testing and Scenario Analysis
While historical data is backward-looking, stress testing and scenario analysis attempt to project how a portfolio might perform under various adverse future conditions.
- Simulated Drawdowns: Running simulations that model your portfolio’s performance during hypothetical market crashes (e.g., a 30% equity market decline, a sudden interest rate spike, a commodity shock).
- Tail Risk Events: Specifically testing for “black swan” events – rare, unpredictable, and high-impact occurrences. How would your portfolio fare if an unforeseen global crisis hit?
- Sensitivity Analysis: Examining how changes in key variables (e.g., inflation, interest rates, currency fluctuations) would impact your portfolio’s drawdown potential.
This proactive approach helps identify potential vulnerabilities before they become actual problems. It allows for adjustments to be made to portfolio construction or risk management strategies to enhance resilience to future drawdowns. For instance, if stress testing reveals an unacceptable level of drawdown risk from rising interest rates, you might consider diversifying into assets that are less sensitive to interest rate movements or implementing specific hedges.
Learning from past drawdowns, both personal and historical, and actively preparing for future ones through stress testing, transforms drawdown from a daunting inevitability into a manageable and even predictable aspect of the investment journey. It empowers investors to build more robust portfolios and cultivate the psychological fortitude necessary to achieve long-term financial success.